I hated numbers when I was young. That is until I figured out that they tell interesting stories. It was during my years in the insurance sector that I realised that I had a secret weapon. I could see patterns in the data. Data analytics and predictive sciences fascinated me. But there was a problem. While I could keep my audience engaged with the data at hand, I needed to be present to take them through it and get them fascinated with the little nuggets of information I had unearthed.
Of course, you could use colour codes and notes in sophisticated ppts to keep the audience engaged but it often lacks the impact of an in-person presentation. That’s because you can weave in the context or story while presenting data in person. Data without context is just a set of numbers and does not leave an impact. In other words, you need to be able to relate to the numbers presented to be able to influence decisions.
That’s why in-person presentations of data were so effective for me. But the in-person method is only effective if you are able to meet the decision-makers and state your case aka story. If you had to rely on third parties to convey your thoughts to the decision-maker, it’s very likely that your story would be distorted or diluted by the time it reached its destination. I wonder how many more arguments I would have won with insurers and clients if I had been able to show them the patterns I was seeing.
Stories to the rescue!
Perhaps that is why I found Richie Lionell V and Ramya Mylavarapu’s book, “From Data to Stories” so interesting. This data comic story is a pleasure to read. The duo keeps the reader engaged with each game’s detailed cricket scorecard and analytics while running a very interesting family story (or is it a love story?) in the background. Wait a minute. Is the cricket data and analysis the main course of the book, or is it Ringo and Priya’s love story? The jury is out on that one, as far as I am concerned.
What hooked me was the ease with which they weaved in interesting snippets of data stories into the main plot. It made the cricketing data interesting to even a non-cricket lover like me (Yes, I know, that’s literally blasphemy in this country). I realised that the style used was very similar to how our team at Clearly Blue weaves in stories to make deep technical courses like Kubernetes, AI and ML more interesting to learners. We normally develop a storyline with characters and take them on a journey of discovery. They start with a problem that they have to solve and find a solution by the end of the course.
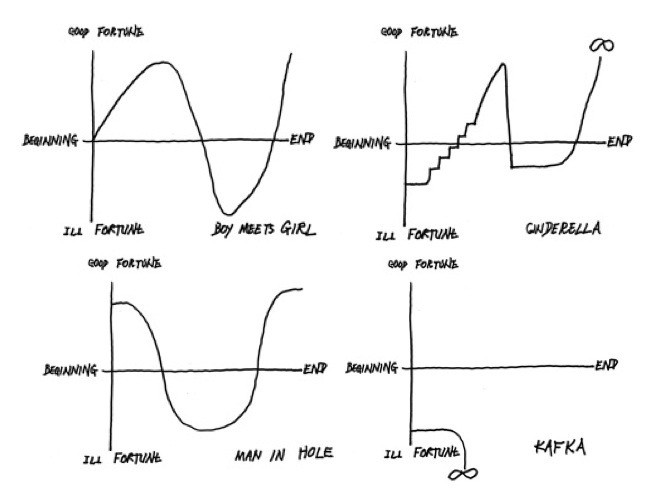
Richie and Ramya talk about similar approaches in the book. I liked their reference to Kurt Vonnegut’s “the shapes of stories”. Adopting one of the story structures detailed in the book, would be an easy way for a beginner to get started.
It’s a comic book!
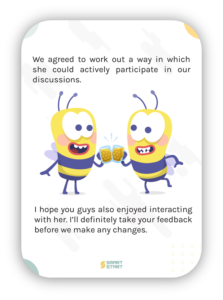
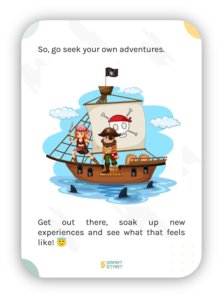
Clearly Blue has been experimenting with the comic strip style of writing as an effective medium of instruction. In fact, we ran such an experiment recently with one of our products, SmartStart, and were astounded by the high engagement rates ( 60%).
Perhaps that’s why Richie and Ramya’s comic book style of telling data stories resonates so well with me. Their style of writing was easy to grasp and not overpowering. I’ve noticed that when the subject is already heavy, like data analytics or deep tech, you want to make it more appealing with a sprinkling of humour and simplicity.
At Clearly Blue we’ve mastered the art of using stories to keep our audience engaged. Be it deep tech or soft skills , we’ve realised that comic strips can help you reach your audience and keep them listening or reading. I can’t wait to try this style on data now. My hands are just itching to make a comic book out of some claims analysis or loss ratio trends. What about a comic book on stock market trends?
I just love it when a book opens up the mind to a million possibilities.
Want to know what Suresh was brooding about?