


All you need to know…
Infographics (a blend of information graphics) are virtually popular in almost every industry – from digital marketing to e-learning, infographics deliver important information in a visually appealing way. Would you want to read a chunk of stats in the form of long sentences?
The Oxford English Dictionary defines an infographic as “a visual representation of information or data”. For an infographic to be deemed “good”, it should have a combination of suitable colours, text/font, icons, and captivating and easily understandable illustrations.
The first infographics were spotted as engravings on the walls of the Serra Da Capivara caves in Brazil, around 25,000 years ago. Next in line is the Dunhuang star atlas from 649-684 AD ancient China, which depicts more than 1,300 stars. Now let’s fast forward to the late 1700s, when print and data visualizations were on the rise. William Playfair, considered the father of modern statistical graphs, invented the time-series line graph, pie chart, and bar chart. To date, these data visualizations are popularly used in infographics as they can depict various data and are easily understandable. Speaking of the 20th century, illustrator and graphic designer Peter Sullivan created stunning infographics for “The Sunday Times” between 1970 and 2000, which inspired many other publications to follow this movement.
Infographics can be used in several ways:
- Share them on social media platforms like Twitter, LinkedIn, Instagram, Facebook, Whatsapp and Pinterest.
- Use them in e-books and online courses to make the learning experience a fun one.
- Display them on your website.
- Incorporate them in blogs, newsletters and presentations.
- They can also be used as promotional material, such as posters or banners.
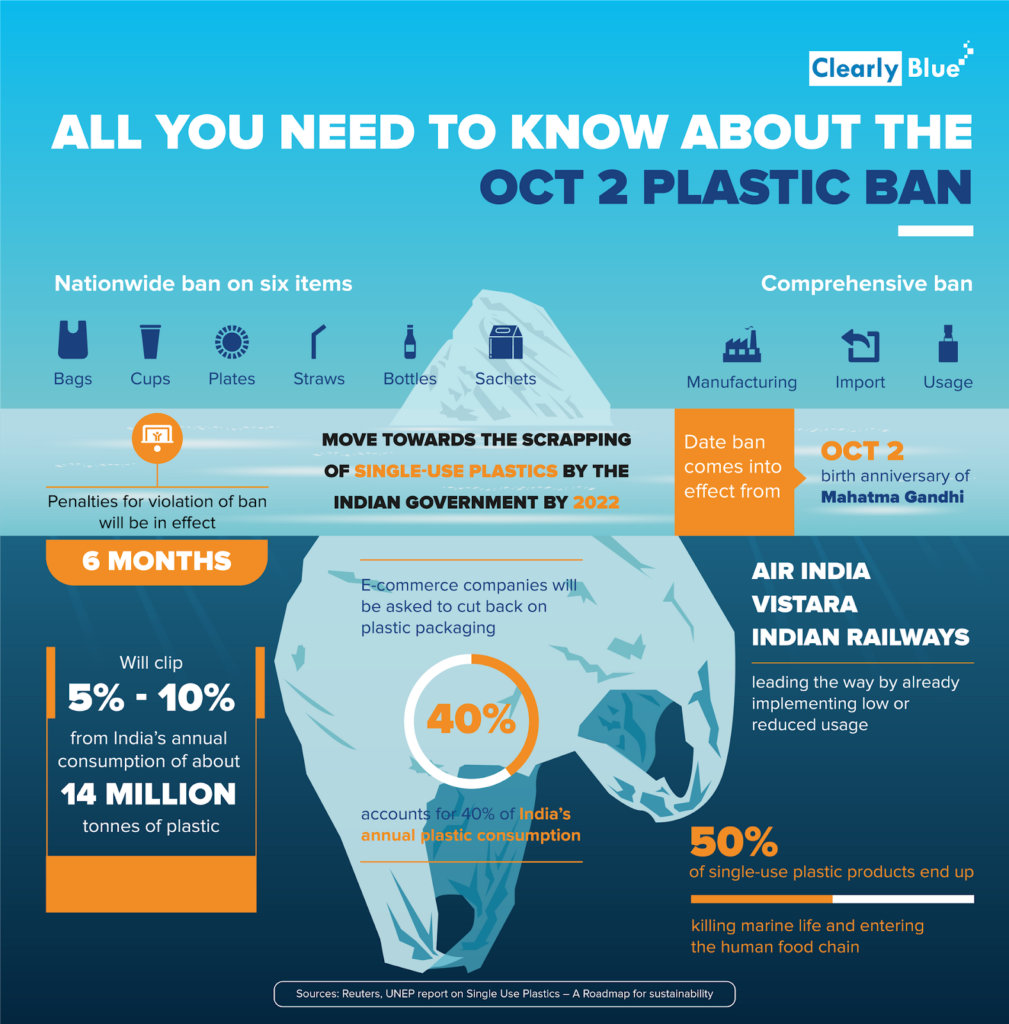
Here’s an infographic we created…

What are the types of infographics?
It would be best if you designed your infographic according to its objective and the nature of the content. It is important to consider your target audience too.
Infographics are commonly used for the following reasons:
- Data illustration – Using graphs, charts, and other graphic tools to present facts and statistics.
- Depiction of complex topics – Using illustrations and visual cues to explain difficult concepts.
- Comparisons – Visually representing the similarities and/or differences between two or more concepts, features, services, products, brands, etc…
- Raising awareness – Highlighting an important cause or creating brand visibility.
- Summaries of long content – Creating bite-sized infographics by taking a gist of long videos, blogs, and reports.
There are several types of infographics based on various purposes:
- Statistical infographics
- Informational infographics
- Process infographics
- Timeline infographics
- Anatomical infographics
- Hierarchical infographics
- List infographics
- Comparison infographics
- Location-based infographics
- Visual resume infographics
How to create an infographic – A short video
Several online platforms such as Canva, Infogram, and Piktochart are easy to use. On the other hand, some of the commonly used professional software include Adobe Illustrator, Adobe Photoshop, and CorelDRAW.
What does it take for an infographic to stand out?
Let’s go through some tips to help make your infographic not only beautiful but effective too.
- Use lines, borders, and shapes to sort the information
- Follow a colour scheme
- Use different fonts of the same family to create a font hierarchy
- Highlight key takeaways using images, icons and illustrations
- Use animated elements – this is the new trend.
Or, you could simply download a suitable template from the internet and personalize it.
Consider the infographic as your storytelling prop…just remember to get creative with infographics!
On the lookout for someone to create stunning infographics? One-off or a series, reach out to us at info@cbnew.test and we would be happy to help!
Sources:
https://venngage.com/blog/what-is-an-infographic/
https://www.copypress.com/kb/infographics/the-history-of-infographics-infographic/
https://www.shoutmeloud.com/how-to-create-infographic-blog-post.html
https://www.socialmediatoday.com/marketing/6-creative-ways-use-infographics-marketing